- What is Ratio Analysis ?
- Techniques Used in Ratio Analysis
- Different Users of Ratio Analysis
- Limitations of Ratio Analysis
- Capital Structure Ratio
- Debt to Equity Ratio
- Debt Ratio
- Equity to Fixed Assets Ratio
- Proprietary Ratio
- Interest Coverage Ratio
- Degree of Financial Leverage Ratio
- Degree of Operating Leverage Ratio
- Degree of Combined Leverage Ratio
- Introduction to Cash Flow Ratios
- Cash Flow to Debt Ratio
- Free Cash Flow to Operating Cash Flow
- Operating Cash Flow to Sales Ratio
- Market Related Ratios
- Price to Earnings (PE) Ratio
- Price Earnings Growth (PEG) Ratio
- Price to Book Value Ratio
- Price to Cash Flow Ratio
- Price to Sales Ratio
- Dividend Yield Ratio
- Put Call Ratio
- Introduction to Liquidity Ratios
- Current Ratio
- Quick Ratio
- Cash Ratio
- What is Negative Working Capital ?
- Introduction to Turnover Ratios
- Accounts Receivable Turnover Ratio
- Accounts Payable Turnover Ratio
- How to Use AP Turnover Ratio
- Fixed Asset Turnover Ratio
- Inventory Turnover Ratio
- Working Capital to Sales Ratio
- Introduction to Profitability Ratios
- What are Common Size Statements ?
- What are Profit Margins ?
- Return on Assets (ROA) - Meaning, Formula, Assumptions and Interpretation
- Return on Equity (ROE) - Meaning, Formula, Assumptions and Interpretation
- Return on Invested Capital (ROIC)
What is Ratio Analysis ?
Ratio analysis is one of the oldest methods of financial statements analysis.
It was developed by banks and other lenders to help them chose amongst
competing companies asking for their credit. Two sets of financial
statements can be difficult to compare. The effect of time, of being in
different industries and having different styles of conducting business
can make it almost impossible to come up with a conclusion as to which
company is a better investment. Ratio analysis helps creditors solve
these issues. Here is how:
What are Financial Ratios ?
- Shortcut: Financial ratios provide a sort of heuristic
or thumb rule that investors can apply to understand the true financial
position of a company. There are recommended values that specific
ratios must fall within. Whereas in other cases, the values for
comparison are derived from other companies or the same companies own
previous records. However, instead of undertaking a complete tedious
analysis, financial ratios helps investors shortlist companies that meet
their criteria.
- Sneak-Peek: Investors have limited data to make
their decisions with. They do not know what the state of affairs of the
company truly is. The financial statements provide the window for them
to look at the internal operations of the company. Financial ratios make
financial analysis simpler. They also help investors compare the
relationships between various income statement and balance sheet items,
providing them with a sneak peek of what truly is happening behind the
scenes in the company.
- Connecting the Dots: Over the years investors
have realized that financial ratios have incredible power in revealing
the true state of affairs of a company. Analyses like the DuPont
Analysis have brought to the forefront the inter-relationship between
ratios and how they help a company become more profitable.
Sources of Data
Here is where the investors get the data they require for ratio analysis:
- Financial Statements: The financial data published by the company and its competitors is the prime source of information for ratio analysis.
- Best Practices Reports: There are a wide range of
consulting firms that collate and publish data about various companies.
This data is used for operational benchmarking and can also be used for
financial data analysis.
- Market: The data generated by all the activity on
the stock exchange is also important from ratio analysis point of view.
There is a whole class of ratios where the stock price is compared with
earnings, cash flow and such other metrics to check if it is fairly
priced.
Techniques Used in Ratio Analysis
Ratio, as the name suggests, is nothing more than one number divided
by the other. However, they become useful when they are put in some sort
of context. This means that when an analysts looks at the number
resulting out of a ratio calculation he/she must have a reasonable basis
to compare it with. Only when the analyst looks at the number and
compares it what the ideal state of affairs should be like, do the
numbers become powerful tool of management and financial analysis.
Dividing numbers and obtaining ratios is therefore not the main skill.
In fact this part can be automated and done by the computer. Companies
wouldn’t want to pay analysts for doing simple division, would they?.
The real skill lies in being able to interpret these numbers. Here are some common techniques used in the interpretation of these numbers.
Horizontal Analysis
Horizontal analysis is an industry jargon for comparison of the same
ratio over time. Once a ratio is calculated, it is compared with what
the value was in the previous quarter, the previous years, or many years
in case the analyst is trying to make a trend. This provides more
information of two grounds. They are:
- Horizontal analysis clarifies whether the company has a
stable track record or is the value of the ratio influenced by one time
special circumstances.
- Horizontal analysis helps to unveil trends which help
analysts unveil trends in the performance of the business. This helps
them make more accurate future projections and value the share
correctly.
Cross-Sectional Analysis
Cross sectional ratio analysis is the industry jargon used to denote
comparison of ratios with other companies. The other companies may or
may not belong to the same industry. Cross sectional analysis helps an
analyst understand how well a company is performing relative to its
peers. In a way this removes the effect of business cycles. There are
many variations of cross sectional analysis. They are as follows:
- Industry Average: The most popular method is to take
the industry average and compare it with the ratios of the firm. This
provides a measure of how the company is performing in comparison to an
average firm.
- Industry Leader: Many companies and analysts are
not satisfied with being average. They want to be the industry leader
and therefore benchmark against them.
- Best Practice: In case, the company is the
industrial leader, then it usually crosses the industry border and seeks
inspiration from anyone anywhere in the world. They benchmark with the
best practices across the globe.
Importance of Different Ratios to Different User Groups
As we have seen earlier that there is a wide variety of financial
ratios available. They fall into many categories and if variations are
included there are hundreds of types of ratios that are common in
practice. However, all the ratios are not used by everyone on a regular
basis. There are some ratios which are more important to some user
groups than they are to other user groups. This article explains why
this is the case:
Management: Turnover and Operating Performance Ratios
The management of the company may not be so concerned with the
results. They are usually more interested in the cause. This is because
while other classes of stakeholders do not have control over the working
of the firm i.e. the cause, the management does. All the other
stakeholders question the management at the annual general meeting.
Hence, management tries to get as much insight into the ratios as
possible. They create operating performance ratios and compare it to
their previous performance and to the performance of others to learn
from the past as well as to be able to give satisfactory answers to the
investors.
Shareholders: Profitability
Shareholders, for obvious reasons, are most concerned about
profitability. Their investments are at risk and they expect to gain the
maximum. Investors scrutinize profitability numbers and pounce upon the
slightest signs of mismanagement. For the shareholders, the
profitability ratios are the beginning point. They then follow the trail
the ratios leave. However over the past two decades the focus has been
steadily shifting towards cash flow ratios.
Debt holders and Suppliers: Cash Flow and Liquidity
Debt holders and suppliers are concerned whether they will be paid
the amount promised to them at the date that was promised to them. It is
for this reason that they are very concerned about the liquidity of the
firm. Slightest signs of liquidity issues are met with supply cutbacks
from suppliers.
The fact that debt holders are concerned about the same ratios
creates a self reinforcing negative loop for the company. This is
because at the same time when suppliers cut credit and supplies, debt
holders refuse to lend more money and the whole situation becomes a cash
crunch.
Credit Rating Agencies: Solvency
While debt holders are suppliers are concerned about short term
liquidity and cash flow, credit rating agencies go a step ahead. They
use solvency ratios to rigorously analyze whether the company will be
able to make good its obligations in the long run.
Limitations of Ratio Analysis
Ratio analysis, without a doubt, is amongst the most powerful tools
of financial analysis. Any investor, who wants to be more efficient at
their job, must devote more time towards understanding ratios and ratio
analysis. However, this does not mean that it is free of limitations.
Like
all techniques, financial ratios have their limitations too.
Understanding the limitations will help investors understand the
possible shortcomings with ratios and avoid them. Here are the shortcomings:
Misleading Financial Statements
The first and foremost threat to ratio analysis is deliberate
misleading statements issued by the management. The management of most
companies is aware that investors look at certain numbers like sales,
earnings, cash flow etc very seriously. Other numbers on the financial
statements do not get such attention. They therefore manipulate the
numbers within the legal framework to make important metrics look good.
This is a common practice amongst publically listed companies and is
called “Window Dressing”. Investors need to be aware of such window
dressing and must be careful in calculating and interpreting ratios
based on these numbers.
Incomparability
Comparison is the crux of ratio analysis. Once ratios have been
calculated, they need to be compared with other companies or over time.
However, many times companies have accounting policies that do not match
with each other. This makes it impossible to have any meaningful ratio
analysis. Regulators all over the world are striving to make financial
statements standardized. However in many cases, companies can still
choose accounting policies which will make their statements
incomparable.
Qualitative Factors
Comparison over time is another important technique used in ratio
analysis. It is called horizontal analysis. However, many times
comparison over time is meaningless because of inflation. Two companies
may be using the same machine with the same efficiency but one will have
a better ratio because it bought the machine earlier at a low price.
Also, since the machine was purchased earlier, it may be closer to
impairment. But the ratio does not reflect this.
Subjective Interpretation
Financial ratios are established “thumb of rules” about the way a
business should operate. However some of these rules of thumb have
become obsolete. Therefore when companies come with a new kind of
business model, ratios show that the company is not a good investment.
In reality the company is just “unconventional”. Many may even call
these companies innovative. Ratio analysis of such companies does not
provide meaningful information. Investors must look further to make
their decisions.
Capital Structure Ratios - Meaning and Importance
Capital structure ratios are very important to analyze the financial statements of any company for the following reasons:
Same Business Can Yield Different Returns
Investors understand that the way a business is funded can have a lot
of impact on the returns it provides. Although the total return
provided will always be the same, the way those returns are distributed
amongst investors will vary. It is for this reason that investors pay
careful attention to these ratios as they help them understand the
consequences of the best and worst possible scenarios.
Combination That Reduces Total Cost of Capital
A firm is a legal entity that has nothing when it first begins
operations. It acquires capital in the form of debt and equity on
different terms. Debt has fixed returns but sure repayments. Equity on
the other hand has uncertain returns but the probability of returns that
far exceed those of debt-holders. There is a cost attached to both debt
and equity and the purpose of an ideal capital structure is to minimize
the total cost.
Nature of Capital Employed Can Magnify Returns
The specific combination of debt and equity employed is capable of
magnifying returns (both gains and losses) for equity investors.
Therefore they have a special interest in ensuring that the capital
structure and leverage position of the firm is in control.
Solvency of the Firm
An incorrect capital structure can mean ruin of an otherwise healthy
firm. This is because, if the firm is funded by too much debt, it has a
lot of interest bills to pay. Therefore in a lean period, the firm is
likely to default on its interest obligations. The worst part is that if
the firm defaults a few times, debt holders have the right to seek
legal counsel and start liquidating the firm. In such a scenario, an
otherwise healthy firm may have to sell its assets at throw away prices.
Thus an ideal capital structure is one that provides enough cushions to
shareholders so that they can leverage the debt-holders funds but it
should also provide surety to debt holders of the return of their
principal and interest. Since capital structure ratios reveal these
facts, analyst pay careful attention to them.
Liquidation of the Firm
Capital structure ratios help investors analyze what would happen to
their investments in the worst possible scenario. In case of liquidation
senior debt holders have the first claim, then junior debt holders and
then in the end equity holders get paid if there is anything left.
Investors can gauge what they are likely to recover if the organization
went bust immediately.
Debt to Equity Ratio - Meaning, Assumptions and Interpretation
The debt to equity ratio is the most important of all capital
adequacy ratios. It is seen by investors and analysts worldwide as the
true measure of riskiness of the firm. This ratio is often quoted in the
financials of the company as well as in discussions pertaining to the
financial health of the company in TV shows newspapers etc.
Formula
Debt to Equity Ratio = Total Debt / Total Equity
The total equity includes retained earnings which have been listed on the balance sheet
There is subjectivity with regards to treatment of preference shares.
Some companies add them to debt while others add them to equity based
on the relative features of the preference shares issued. However,
usually the quantum of preference shares in not big enough to make a
difference.
Meaning
The debt to equity ratio tells the shareholders as well as debt
holders the relative amounts they are contributing to the capital. It
needs to be understood that it is a part to part comparison and not a
part to whole comparison.
Assumptions
The debt to equity ratio measures the amount of debt based on the
figures stated in the balance sheet. Of late there have been many ways
figured out to take on debt without it showing up on the balance sheet.
The debt to equity ratio is a very old measure and is not meant to take
into account such complication. Some analysts factor in off balance
sheet debt as well to get a better picture. However, they do not have
enough information to be very accurate at this endeavor.
Interpretation
Debt to equity ratio provides two very important pieces of information to the analysts. They have been listed below.
- Interest Expenses: A high debt to equity ratio implies
a high interest expense. Along with the interest expense the company
also has to redeem some of the debt it issued in the past which is due
for maturity. This means a huge expense. Moreover this expense needs to
be paid in cash, which has the potential to hurt the cash flow of the
firm. Investors are never keen on investing in cash strapped firm and
therefore have a keen eye on this ratio.
- Liquidation Scenario: Another interpretation of
the debt equity ratio is the event of a liquidation of the company.
Shareholders as well as debt holders want to know what the maximum
downside is and debt to equity ratio helps them understand what they
would end up with if the company were to stop functioning as a going
concern.
Debt Ratio - Formula, Meaning, Assumptions and Interpretatio
The debt ratio is the second most important ratio when it comes to
gauging the capital structure and solvency an organization. This article
provides an in-depth look.
Formula
Debt Ratio = Total Debt / Total Capital
The debt ratio is a part to whole comparison as compared to debt to
equity ratio which is a part to part comparison. Another major
difference between the debt to equity ratio and the debt ratio is the
fact that debt to equity ratio uses only long term debt while debt ratio
uses total debt.
Total debt means current liabilities are also included in the
calculation and so is the debt due for maturity in the coming year.
Meaning
The debt ratio tells the investment community the amount of funds
that have been contributed by creditors instead of the shareholders. The
creditors of the firm accept a lower rate of return for fixed secure
payments whereas shareholders prefer the uncertainty and risk for higher
payments. If too much capital of the company is being contributed by
the creditors it means that debt holders are taking on all of the risk
and they start demanding higher rates of interest to compensate them for
the same.
Assumptions
Like debt to equity ratio, the debt ratio assumes the absence of off
balance sheet financing. However given the fact that companies now
indulge in structured finance and derivatives to a very large extent
this assumption seems unreasonable.
Interpretation
The debt ratio of a company is highly subjective. There is no such
thing as an ideal debt ratio. Neither are industry wide comparisons very
helpful because the capital structure of a company is an internal
decision. Here is how to interpret the debt ratio of a company.
- Certainty: Debt is not harmful as long as the revenues
in question are fairly certain. Debt becomes a problem when the
revenues of the company are wildly fluctuating. This is when there arise
situations when the company may not have enough cash on hand to meet
its interest obligations. Hence while looking at the debt ratio analysts
usually also look at the revenues with regards to how certain they are
to gauge the riskiness. Whether these revenues are converted to cash
fast enough to meet the interest obligations is also under
consideration.
- Tax Shield Advantages: Debt is a tax deductible
expense. Hence the amount of interest paid reduces the tax bill of the
company. One of the advantages of having a higher debt ratio is that you
have to pay less to the government in taxes.
Proprietary Ratio - Meaning, Assumptions and its Interpretation
The proprietary ratio is not amongst the commonly used ratios. Very
few analysts prescribe its usage. This is because in reality it is the
inverse of debt ratio. A higher debt ratio would imply a lower
proprietary ratio and vice versa. Hence this ratio does not reveal any
new information.
Formula
Proprietary Ratio = Total Equity / Debt + Equity
Meaning
The proprietary ratio is the inverse of debt ratio. It is a part to
whole comparison. The proprietary ratio measures the amount of funds
that investors have contributed towards the capital of a firm in
relation to the total capital that is required by the firm to conduct
operations.
Assumptions
- No off Balance Sheet Debt: The presence of off balance
sheet debt may understate the total debt that the firm has. This in
turn will overstate the proprietary ratio. Such accounting can be
thought of as deceptive because it masks the true risk profile of the
business. However, since accountants would be on the right side of the
rules, it is not incorrect for them to do so.
Interpretation
- Depends on Risk Appetite: The ideal value of the
proprietary ratio of the company depends on the risk appetite of the
investors. If the investors agree to take a large amount of risk, then a
lower proprietary ratio is preferred. This is because, more debt means
more leverage means profits and losses both will be magnified. The
result will be highly uncertain payoffs for the investors.
On the other hand, if investors are from the old school of thought,
they would prefer to keep the proprietary ratio high. This ensures less
leverage and more stable returns to the shareholders.
- Depends on Stage of Growth: The ideal value of
the proprietary ratio also depends upon the stage of growth the company
is in. Most companies require a lot of capital when they are at the
early stages. Issuing too much equity could dilute the earnings
potential at this stage. Therefore a lower proprietary ratio would be
desirable at such a stage allowing the firm to access the capital it
wants at a lower cost.
- Depends on Nature of Business: The firm has to
undertake many risks and balance them out. There are market risks which
are external to the firm and there are capital structure risks that are
internal to the firm. If the external risks are high, the firm must not
undertake aggressive financing because this could lead to a complete
washout of the firm. On the other hand, if the external environment is
stable, the firm can afford to take more risks.
Interest Coverage Ratio - Meaning, Assumptions and Interpretation
The interest coverage ratio is a number that has a lot of importance
for the creditors of the firm. This number tells them how safe their
investments are and how likely they are to get back principal and
interest on time.
Formula
Interest Coverage Ratio = EBIT / Interest
Meaning
The interest coverage ratio tells investors how many rupees they have
made in profit, per rupee of interest that they owe to their
shareholders. Thus if the interest coverage ratio is 3, then the firm
has 3 rupees in profit for every 1 rupee in interest obligations. Thus
profits will have to fall by more than 66% for the firm to register a
loss.
Assumption
The standard assumption of no accounting manipulation in either of
the two numbers involved (EBIT and Interest expenses in this case) is
made while calculating the interest coverage ratio.
Interpretation
- Higher Ratio Means Solvent: The higher the interest
coverage ratio of any firm, the more solvent it is. If an organization,
under normal circumstances, earns way more than what its interest costs
are, then it is financially secure. This is because earnings would have
to take a real beating for the firm to default on its obligations.
Hence, interest coverage ratio is of prime importance to lenders like
banks and bond traders. Credit rating agencies also pay close attention
to this number before they rate the company.
- Tolerance Depends On Variability: In industries
where sales are very stable, such as utilities companies, a lower
interest coverage ratio should suffice. This is because, these
industries, by nature record stable revenues. Hence the sales and
profits of the company are unlikely to witness wild fluctuation. This
means that even in tough times the company will most probably be able to
make good its interest obligations because its performance is not
affected by the business cycle.
On the other hand, companies with highly variable sales, like
technology and apparel companies, need to have a high interest coverage
ratio. These industries are prone to wild fluctuations is sales and
investors want to ensure that their cash flow is not interrupted as a
result. Hence they demand a higher interest coverage ratio before they
give out their money.
- Ability To Take On More Credit: This is a
corollary of the fact that high interest coverage ratio means the
company is solvent. Lenders want to lend money to people who are
solvent. This ensures that they get repaid on time and the risks of
business are assumed by the owner. Thus, companies with high interest
coverage ratios are more likely to get credit easily and on more
favorable terms.
Degree of Financial Leverage Ratio
A high debt equity ratio makes the company financed by debt more than
by equity. Therefore there are fixed interest payments involved. Hence
when the going is good, the company makes a handsome return as a small
percentage of change in EBIT creates a large percentage change in
earnings per share. However the inverse of this is also true. Just like
financial leverage helps to magnify profits, it also magnifies losses
when EBIT fall down. Analysts want to quantify exactly how much
variability does debt funding create in the operations of a particular
company and have created a measure called “Degree of Financial Leverage”
which we will study in detail.
Formula
Degree of Financial Leverage = % Change in EPS / % Change in EPS
There is a reasonable assumption about the absence of any changes in
accounting policy which would make the EPS and EBIT figures incomparable
from the previous years.
Example
- Profit Magnification Example: The best example of
degree of financial leverage is in the field of home ownership. Let’s
say that you brought a house for Rs 100. It is financed 30% by own money
and 70% by debt bearing interest of 10%.
Thus, you are obligated to pay Rs 7 interest each year, regardless of
what happens. Lets say that the price of the house went up by 20% to
120. In this case you will pay back the creditors Rs 77 (principal +
interest) and be left with Rs 43. Since your original investment was Rs
30, you have gained Rs 13.
A price increase of 20% has led to an increase in the shareholders return by approximately 43%!
- Loss Magnification Example: Let’s say that you brought the same house for Rs 100. It is financed 30% by own money and 70% by debt bearing interest of 10%.
Thus, you are obligated to pay Rs 7 interest each year, regardless of
what happens. Lets say that the price of the house went down by 20% to
Rs 80. In this case you will pay back the creditors Rs 77 (principal +
interest) and be left with Rs 3. Since your original investment was Rs
30, you have lost Rs 27.
A price decrease of 20% has led to a decrease in the shareholders return by approximately 90%
Interpretation
Leverage is very dangerous unless the company is reasonably certain
of its earnings. Investors view the leverage ratio with great detail.
This is because it enables a small change in the EBIT to completely wipe
out the company’s capital and make it insolvent almost overnight.
Degree of Operating Leverage Ratio
The degree of operating leverage of a company is very important from
an investor’s standpoint. Although it shows the riskiness of a venture,
it also shows the efficiency of a company. Just like, financial leverage
arises out of the capital structure of a company, operating leverage
arises out of its cost structure. If a company has too many expenses
which are fixed in nature, the company is said to have high operating
leverage.
Typically companies that are highly mechanized have high operating
leverage. This is because they have replaced labor which is a variable
cost by depreciation on machinery which is a fixed cost. This creates
debate whether having a high operating leverage is a bad thing. Henry
Ford was amongst the first to use operational leverage on a large scale
and build cars at a fraction of what it would cost earlier. This idea
was soon followed by many others and high operating leverage became the
norm.
Formula
Degree of Financial Leverage = % Change in Sales / % Change In EBIT
The ratio makes a reasonable assumption that accounting policies have
not changed so much that the Sales and EBIT figures do not remain
comparable across companies or across time.
Example
- Profit Magnification Example: In case a company has a
high operating leverage, most of its costs are fixed. Consider for
example, the movie business. The costs incurred to make the movie are
fixed. Hence when tickets are sold, the first few tickets go towards
recovery of the cost of production. However, once a breakeven point has
been reached, entirely all the money goes towards the bottom line. Hence
a slight change in sales has the capability to magnify and bring about a
big change in EBIT.
- Loss Magnification Example: However, every lever
has its flipside and operating leverage is no exception. Since most of
the costs are fixed, in the vent of a downturn, the company does not
have the opportunity to cut costs. In many cases, companies are not able
to fulfill their requirements to meet the fixed cost obligation.
Whereas all companies are hurt in the event of a downturn, companies
with excessively high operating leverage are wiped out in such events.
Interpretation
Whether operating leverage is good or bad for a company depends on
the nature of its operations and stability of its cash flow streams. In
case of stable operations, high operational leverage in desirable and
even recommended.
Degree of Combined Leverage Ratio
Most firms use both operating leverage and capital leverage to some
extent. In today’s business world it is almost impossible to run a
business without having some degree of automation and mechanization
(operating leverage). It is also not possible to grow at an adequate
speed unless the company is taking advantage of borrowed money.
However, the degree to which a company uses operating leverage and
financial leverage can be different. Some companies use more financial
leverage than operating leverage while other use more operating
leverage. This creates a challenging scenario whereas an analyst has to
interpret the different degrees of riskiness of companies with different
cost and capital structures. The degree of combined leverage (DCL)
makes it possible to do this.
Formula
- Degree of Combined Leverage = %Change in EPS / %Change in Sales
- Degree of Combined Leverage = Degree of Operating Leverage * Degree of Financial Leverage
Example
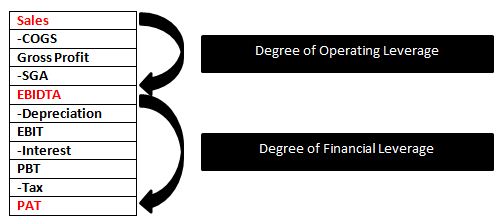 PAT / Number of Shares = Earnings per Share (EPS)
Therefore if operating leverage of a firm= 1.4 whereas financial
leverage = 2, then the degree of combined leverage equals 1.4*2 = 2.8
Interpretation
Degree of operating leverage shows how a change in sales affects the
EBIDTA of the firm. Whereas degree of financial leverage shows how a
change in EBIDTA affects the EPS of the firm. Combining the two analysts
can predict how a change in sales is likely to magnify the gains or
losses to the EPS.
Debt Ratio - Formula, Meaning, Assumptions and Interpretation
The debt ratio is the second most important ratio when it comes to
gauging the capital structure and solvency an organization. This article
provides an in-depth look.
Formula
Debt Ratio = Total Debt / Total Capital
The debt ratio is a part to whole comparison as compared to debt to
equity ratio which is a part to part comparison. Another major
difference between the debt to equity ratio and the debt ratio is the
fact that debt to equity ratio uses only long term debt while debt ratio
uses total debt.
Total debt means current liabilities are also included in the
calculation and so is the debt due for maturity in the coming year.
Meaning
The debt ratio tells the investment community the amount of funds
that have been contributed by creditors instead of the shareholders. The
creditors of the firm accept a lower rate of return for fixed secure
payments whereas shareholders prefer the uncertainty and risk for higher
payments. If too much capital of the company is being contributed by
the creditors it means that debt holders are taking on all of the risk
and they start demanding higher rates of interest to compensate them for
the same.
Assumptions
Like debt to equity ratio, the debt ratio assumes the absence of off
balance sheet financing. However given the fact that companies now
indulge in structured finance and derivatives to a very large extent
this assumption seems unreasonable.
Interpretation
The debt ratio of a company is highly subjective. There is no such
thing as an ideal debt ratio. Neither are industry wide comparisons very
helpful because the capital structure of a company is an internal
decision. Here is how to interpret the debt ratio of a company.
- Certainty: Debt is not harmful as long as the revenues
in question are fairly certain. Debt becomes a problem when the
revenues of the company are wildly fluctuating. This is when there arise
situations when the company may not have enough cash on hand to meet
its interest obligations. Hence while looking at the debt ratio analysts
usually also look at the revenues with regards to how certain they are
to gauge the riskiness. Whether these revenues are converted to cash
fast enough to meet the interest obligations is also under
consideration.
- Tax Shield Advantages: Debt is a tax deductible
expense. Hence the amount of interest paid reduces the tax bill of the
company. One of the advantages of having a higher debt ratio is that you
have to pay less to the government in taxes.
Introduction to Cash Flow Ratios
Once upon a time, investors and analysts used to believe in ratios
that have been calculated based on the earnings that the company has
stated in the Income Statement. Alas! That was once upon a time. Of
late, there have been a huge number of frauds and malpractices that have
come to the fore. All these malpractices have taught the investors one
lesson only. The lesson is that fact that corporate income statements
and balance sheets are susceptible to fraud. This is because the numbers
in these statements are based on the policies that management sets.
Thus, in the seas of fraud, they have found truth in cash flow ratios.
Here is why cash flow ratios are so important and form the backbone of
any financial analysis conducted today.
Cash Flow is Fact
Cash flow is fact, all else is error, or at least susceptible to
error. The company cannot fudge how much cash it has in the bank. The
auditors are supposed to confirm with the bank the amount of cash that
they have in the company’s accounts and verify the same with what the
company has stated. How the company received this cash is also made
clear by the cash flow statement. Hence, it is the least susceptible to
fraud and provides the truest picture of the state of affairs.
Company Expenses Cash
The company cannot pay its employees in earnings. Neither can it pay
its creditors or suppliers in earnings. The fact of the matter is that
the company needs cash like humans need oxygen to stay alive. A few days
without adequate cash and the company may not survive. This is the
reason investors want to ensure that they have enough cash on hand to
meet forthcoming obligations. To many investors it seems insane that
expenses like interest be compared with earnings since if earnings are
not converted to cash, they cannot pay expenses. Therefore cash is what
matters!
Company Invests Cash
The company invests cash when it makes capital expenditures. These
capital expenditures are what makes the company’s profits and cash flow
grow in the future. Therefore, it makes more sense to consider cash flow
rather than earnings while trying to gauge the rate at which the
company will grow in the future.
There is no Consensus on Definition of Cash Flow
There is a slight problem with cash flow ratios though. There has
been no consensus on what constitutes cash flow. Hence there are many
measures of cash flow instead of one. This leads to there being multiple
ratios.
Cash Flow to Debt Ratio
Formula
Cash Flow to Debt Ratio = Operating Cash Flow / Total Debt
Meaning
The cash flow to debt ratio tells investors how much cash flow the
company generated from its regular operating activities compared to the
total debt it has. For instance if the ratio is 0.25, then the operating
cash flow was one fourth of the total debt the company has on its
books. This debt includes interest payments, principal payments and even
lease payments to cover off balance sheet financing.
Assumptions
- Does Not Cover Amortization: The cash flow to debt
ratio assumes interest and principle payments will be paid in the same
manner over the years as they have been paid in this year. This
assumption is implicit in the fact that while calculating total debt
(denominator) we take the interest and principal payments from the
present year financial statements.
However, this may not be the case. Companies have access to a variety
of financing schemes. Some of these schemes include interest only
payments, bullet payments, balloon payments, negative amortization, so
on and so forth. In such innovative amortization, there may be years
when the company has to pay a lot of interest and other years when it
has to pay none. Hence the present years figures may not be indicative
of the future.
- Does Not Cover Lease Increment: Once again, the
ratio takes the lease numbers from the financial statements of the
current year. However, most lease contracts nowadays have lease
increment provisions in them. This means that every year the lease may
go up by a certain percentage. The ratio does not cover this aspect.
Interpretation
- Creditworthiness: Cash flow to debt ratio is the true
measure of the creditworthiness of a firm. This is because a company has
to pay its interest and retire its debt by paying cash. They cannot
pass on the earnings that they may have recorded on accrual basis to
creditors to satisfy their claims. Earlier analysis used earnings
because at that time credit periods were small or nonexistent and
therefore earnings to some extent meant cash flow. However, with the
proliferation of credit, the distinction has been widened. A company may
book earnings immediately and not receive cash for years on end. Thus
creditors have their eyes set on cash flow ratios.
- Analysis of the Past: The cash flow to debt ratio
thus becomes an analysis of how comfortably the company paid its
obligations in the past. The future may or may not be similar. Analysts
have to make adjustments to this ratio to make it more meaningful.
Free Cash Flow to Operating Cash Flow Ratio
The free cash flow to operating cash flow ratio is different from
other ratios. It is different in the sense that it is comparing two
measures of cash flow. Usually cash flow ratios compare a cash flow item
to an item on the income statement or on the balance sheet. Here are
the details of this ratio:
Defining the Terms
The terms used in the ratio i.e. operating cash flow as well as free
cash flow have been described in the cash flow section. But here is a
quick refresher.
Operating Cash Flow: Operating cash flow is considered by many
to be the most appropriate measure of cash flow. It measures the cash
flow that the company has been able to generate from its regular day to
day operations. Cash flow generated from onetime events such as sale of
assets and investments is not a part of this. Hence investors can expect
this cash flow to continue in the next period.
Free Cash Flow: Free cash flow is not listed on the cash flow
statement. Rather it is derived by subtracting the capital expenditure
from operating cash flow. This measure is important because this is the
amount of cash flow that the investors have left after meeting the
growth needs of the firm.
Formula
The name of the ratio pretty much gives away the formula. The formula is as follows:
Free Cash Flow to Operating Cash Flow Ratio = Free Cash Flow / Operating Cash Flow
Meaning
This ratio tells the investors about how much free cash flow is being
generated for every rupee of operating cash flow. A higher ratio means
company is not investing too much in capital expenditure and therefore
maybe a mature company that is not seeking any more growth but rather
seeking to sustain its operations.
Interpretation
- Compare With Maturity of the Firm: The stage of
maturity of the firm has a huge impact on the free cash flow to
operating cash flow ratio. Mature stable firms do not need to make too
many capital investments and thus have a higher ratio. On the other hand
companies that are growing will have a lower ratio. One needs to start
questioning if mature companies have lower ratios or vice versa.
- Gestation Period: The gestation period is the
time that is taken for the capital expenditure to start producing
revenues and cash flows. A company with a high gestation period will
invest more and more each year, the effects of which will not be visible
in the free cash flow to operating cash flow ratio until many years.
Operating Cash Flow to Sales Ratio
Formula
The formula for this ratio can be easily judged by its name:
Operating Cash Flow to Sales Ratio = Operating Cash Flow / Sales
Meaning
- Used Over a Period of Time: Conclusions must not be
drawn based on a single number. A company may be able to convert its
sales to cash for one year. But it is consistent, sustained record to do
so that makes it more valuable.
- Cash Flow Should Move In Direction And Proportion With Sales:
If the sales are genuine, the cash flow will move more or less in
correlation with the sales figure. The direction of movement and the
quantum of change must be highly correlated with the sales figures.
Assumptions
- Earnings Have Not Been Manipulated: As has been
discussed many times before, earnings are subject to easy manipulation
by the management. Thus if the management changes the policies from one
year to another, then the numbers are just not comparable.
- Cash Flow Has Not Been Manipulated: The total
cash flow cannot be manipulated. However, companies have got innovative
and have indeed shifted cash flow from financing and investing sections
to the operating section. Thus analysts need to be wary of such
accounting tricks at play to make the numbers look better than they are.
Interpretation
- Are The Company’s Sales Genuine: The operating cash
flow to sales ratio provides the analyst insight into the sales of the
company. It is a known fact that companies can fudge the sales number
relatively easily. This can be done by changing the revenue recognition
policy which allows accountants to book future income as income today.
Sometimes companies do fake transactions to ensure that sales numbers
look good to the stock market. However, the acid test comes when sales
need to be converted to cash. Only genuine sales bring in cash flow.
Thus analysts can make more accurate prediction of the future years cash
flows and therefore value the stock more accurately.
- Compare With Days Sales Outstanding: The
operating cash flow to sales ratio should also be somewhat in line with
the days receivables outstanding ratio. For instance if 90 days
receivables are outstanding, it means on an average the company extends
credit for (90/360), 25% of its sales at any given point of time. Thus
in this case the operating cash flow to sales ratio must be 75% or
close. This makes the analysts more sure that the financial statements
of the firm are indeed genuine.
Market Related Ratios - Meaning and Its Importance
Most investors do not invest directly in the company i.e. they are
not promoters of the company. Rather they invest in the company through
the stock market. This means that they buy shares at a certain value and
make a profit only when the price of the shares go up or they get
regular dividends from their investments or a combination of both. This
is the reason why investors are particularly interested in how the
current share price of the company compares with its fundamentals.
Market related ratios help investors use the numbers stated on the
balance sheet to better their understanding of the same.
What Are Market Related Ratios?
Market related ratios compare the current stock price of the
company which is being quoted on the stock exchange to various balance
sheet, income statement and cash flow items. One component of all market related ratios is the current stock price.
Why the Stock Price Is Not the Actual Price?
It is important to understand that the quoted stock price is not the
actual price of the share. The stock price just means the price that you
are paying to obtain a fraction of the earnings of the company. So if
you are buying 1 share at USD 10 and there are 100 shares, you own 1% of
the company. This 1% ownership means you get 1% of the profit, which in
our case is let’s say USD 2. Hence the actual price you are paying is
USD 10 to buy a future recurring profit stream of USD 2 per share. Of
course these profits subject to risks and that is what makes investing
challenging.
Since the quoted stock price is not the actual price, market related
ratios offer a window to analysts using which they can gauge whether a
stock is over or under valued and then act accordingly.
How Do These Ratios Help In Valuation?
- Expose the Fundamentals: Unless the market is being
completely driven by sentiments at a given point of time, market related
ratios expose the fundamentals of the company in question. This is
because prices in the stock market are generally a reflection of the
long term value that investors see in the company.
- Makes It Easier to Maintain Changes in the Stock Price:
Investors can compare changes in fundamentals to changes in stock
prices to see whether or not the share is fairly valued. Market related
ratios have been long used by savvy investors to make successful long
term investments.
Price to Earnings (PE) Ratio
The price to earnings ratio is the most fundamental of all market
related ratios. It has been used for decades by stalwarts in the
investment community. However, it is also the ratio that has come under
maximum fire from the skeptics. A variety of measurements have been
developed to compensate for what skeptics call the lack of correct
information provided by the price earnings ratio. Almost all other
market related ratios are a variation of the price to earnings ratio.
Formula
Price to Earnings Ratio = Current Market Price / Reported Earnings of the Company
Meaning
The price to earnings ratio tells the investors how many rupees they
are paying for every rupee in earnings that the company presently has.
If the price to earnings ratio is 5, then investors are paying 5 rupees
to get a stream of earnings of 1 rupee per year till perpetuity. This
ratio therefore also implicitly tells the payback period which in this
case would be 5 years.
Assumptions
There are a lot of assumptions that the price to earnings ratio
implicitly makes. This is the reason that this ratio has come under a
lot of criticisms from skeptics who think that price to earnings ratio
provides a distorted image of what the reality of the company really is.
The common assumptions are as follows:
- Earnings are Stable: The price to earnings ratio
implicitly assumes that the earnings of a given company will remain
stable over the period of time that the investment made is being
recovered. However, this is seldom the case. Businesses are subject to
business cycles and earnings move cyclically. The world is yet to see a
company that has been able to generate stable earnings for an extended
period of time. This is why the price earnings ratio may present reality
to be different than what it really is.
- Earnings Have Not Been Manipulated: There is a
lot of evidence that the earnings of a company are subject to gross
manipulation. The management has an unfair control over what it can
project to the investment community as earnings. Moreover the investment
community may not enough data at hand to adjust these earnings and
arrive at a figure which they think are fair earnings of the company.
Hence, na�ve investors who only look at price-earnings ratios without
looking at whether the earnings have been manipulated will possibly make
wrong decisions based on this number.
Interpretation
The price to earnings ratio must be interpreted in the light of the
fundamentals of finance. These fundamentals are the fact that an
investment grows over a period of time. This growth pattern usually
follows an exponential pattern which makes the phenomenon of compounding
so important.
- Does Not Factor In Growth Rates
- Does Not Factor In Compounding
The fact that price to earnings ratio uses simple arithmetic division
makes it unacceptable to many skeptics in the investment community.
Price Earnings Growth (PEG) Ratio
The Price Earnings Growth (PEG) Ratio is one of the first variations
that were made to the Price to Earnings Ratio to make it more
meaningful. The full form of the PEG Ratio is Price Earnings Growth
ratio. Instead of being a two way comparison between price and earnings,
the PEG ratio makes a three way comparison. The first step is to arrive
at the price to earnings ratio whereas the next step is to divide this
ratio by the growth rate of the company to arrive at the PEG ratio.
The PEG ratio was developed because investors argued that current
stock market price is an expectation of future gains to be made by the
company in question. Therefore valuing it solely on the basis of the
current year’s earnings is incorrect. They realized that two companies
could currently have the same earnings but the one that has been growing
its earnings faster needs a better valuation. It is for this reason
that they started factoring in growth rates before concluding whether
the company is fairly prices.
Formula
PEG Ratio = Price to Earnings Ratio / Growth Rate
The growth rate is calculated based on historic data. Analysts could
use as much data as they feel is comfortable without losing the current
trend of earnings of the company in question. This growth rate is
usually expected as a percentage out of 100. For example, if a company
has a growth rate of 20% and a P/E Ratio of 30. Then the PEG Ratio will
be:
PEG Ratio = 30/20 = 1.5
Assumptions
- Growth Rate Expected to Continue: The PEG Ratio is an
extension on the P/E Ratio and therefore makes some of the audacious
assumptions that the P/E Ratio makes as well. The PEG Ratio assumes that
the current rate of growth of the company is expected to continue.
However, in reality trends usually last for 4 to 5 years. So by the time
the analyst does figure out the trend, it would be affected by the
cyclical nature of business and may have changed.
Interpretation
- Fairly Priced Will Equal Growth Rate: Veteran
investors place a lot of faith in the PEG ratio. They believe that in
the long term, the P/E ratio of the company will always equal its growth
rate. Therefore if the PEG ratio is equal to 1, then the company is
fairly priced. This means that investors must actively scout for
companies with PEG ratios less than 1.
Price to Book Value Ratio
Formula
Price to Book Value = Current Market Price / Total Assets – Intangible Assets
The value of assets is taken from the most recently published balance sheet.
Meaning
The price to book value ratio looks at an immediate liquidation
scenario. Investors therefore compare the price that they are paying for
the company against what they would receive if the business shut
operations right away.
Assumptions
- Intangible Assets are Worthless: The price to book
value excludes intangible assets from the calculation of book value.
This can be misleading since intangible assets like patents can provide
cash flows even if the company is being liquidated immediately.
- Tangible Assets are Represented at Fair Price:
The ratio assumes that management have stated the assets at their fair
book value i.e. there has been no manipulation using less depreciation
to make the assets look overvalued.
Interpretation
The price to book value ratio can be used to make some serious
interpretations about the business of the company and how the market is
reacting to it. Here are some of the common interpretations made on the
basis of price to book value ratio:
- Underpriced or Fundamentally Wrong: A lower price to
book value ratio is a very rare occurrence. All companies that are
traded on the stock exchange are usually valued above what they have in
assets. However, when such a scenario arises, one of the two situations
is true. Either the market has overlooked a possible free lunch or the
market knows that there are some serious flaws in the fundamental nature
of the business. The analyst must therefore look at a low price to book
value ratio as a starting point to understand which of the two is the
reality.
- Bankruptcy Bets: The price to book value has
proved to be very useful for speculators making bankruptcy bets. A
useful example of this would be the Satyam fiasco. When it was
discovered that there was a fraud of huge magnitude in the company,
everyone wanted to get rid of the share. In this mania, the stock price
plummeted to an unrealistically low level. Investors who had an eye on
the Price to Book Value ratio found that even if the company wound up
its operations at its book value, they would still be left with more
book value per share than the then prevailing market price per share.
Such bets are usually risky because it is difficult to trust the book
value stated on financials that have been admitted to be doctored with.
Price to Cash Flow Ratio
“Cash is King” say the bigwigs on Wall Street. That is why the
valuation of shares is done on the basis of discounted cash flow model
rather than discounted earnings model. The price to cash flow ratio
provides an analyst with a shortcut for finding companies that have been
undervalued in comparison to their cash flows. Analysts can scan
through the price to cash flow ratios of a number of companies. Then
they can start paying more attention to the companies where these values
seem to be abnormally low. This article describes price to cash flow
ratio is more detail.
Formula
There are many different measures of what analysts consider to be the
true cash flow of the company. Some analysts consider operating cash
flow i.e. cash flow generated from regular activities to be the correct
measure. Others think that the capital investments that the company
needs to make must be separated and the resultant free cash flow
provides a better picture of the company’s fundamentals. Accordingly
there are at least two cash flow measures that an analyst can look at
and here are their formulas:
Price to Operating Cash Flow = Current Market Price / Operating Cash Flow
Price to Free Cash Flow = Current Market Price / Free Cash Flow
Meaning
The price to cash flow ratio tells the investor the number of rupees
that they are paying for every rupee in cash flow that the company
earns. Thus if the price to cash flow ratio is 3, then the investors are
paying 3 rupees for a stream of future cash flows of 1 rupee each. This
cash flow is passed on to the investors as dividend. In case, it is
reinvested in the business, it shows up as capital appreciation. Thus
cash flow will help the investors gain in one way or another.
Interpretation
- Cannot be Manipulated: The price to cash flow ratio is
considered to be a more stringent measure by many. The basic reason
being that cash flow cannot be manipulated. Cash in the bank is a fact
unlike earnings which are the management’s opinion. Charges like
depreciation, changes in inventory and revenue policy do not affect the
cash position making it the favorite of skeptics.
- No Effect of Compounding: The price to cash flow
ratio does not consider the effect of compounding. Once cash is received
it can be immediately put to work to earn even more cash. However, the
ratio fails to capture this phenomenon.
Price to Sales Ratio
Formula
Price to Sales Ratio = Current Market Price / Reported Sales Revenue
Many companies state their revenue after removing the effects of
onetime events whereas others continue to state the revenue without any
adjustments.
Meaning
The price to sales ratio tells an investor how many dollars they are
paying for every dollar that the company has in sales. Hence if the
price to sales ratio is 3, investors are paying 3 dollars for every
dollar in sales. This needs to be benchmarked against the industry
average to understand the context.
Assumptions
As in all market value ratios, there is an unrealistic assumption in
price to sales ratio too. The assumption is that sales will continue to
behave in the same manner for an extended period of time. However,
analysts are not so concerned about sales being absolutely flat for an
extended period of time. They are more concerned about the average value
of sales for the future periods being the same or higher than it
currently is.
Interpretation
- More Sales Mean More Profits: Investors often assume
that the company will make more sales and earn the same rate of return
that it is currently earning. However, this assumption is against the
fundamental laws of economics. Economics state that price must be
reduced to achieve a higher sales volume. It also stated that costs
decrease when scale increases. Hence the profitability of the company is
unlikely to be the same with increasing or decreasing sales volumes.
- More Reliable Than Earnings: Proponents of the
price to sales ratio are mostly critics of the price to earnings ratio.
They understand the importance of comparing the current market price to
fundamentals in the financials of the firm. However, they believe
earnings are subject to too much manipulation which can be difficult to
detect. Sales on the other hand are subject to less manipulation. The
sales figure can only be manipulated if there is a change in the revenue
recognition policy. This policy is one of the first that is read by
analysts and any manipulation here is easily detected.
- Sales Are Subject To Manipulation Too: There have
been cases where sales have been wrongly stated without corresponding
changes in the revenue recognition policy. However, these are cases of
outright fraud rather than cooking the books. There is very little an
investor can do to protect against such frauds.
As an absolute measure, price to sales ratio may not be perfect.
However, ration analysis is not about absolute perfection. Price to
sales is a better indicator of the fundamentals of the company as
compared to price to book value, in the opinion of many critics.
Dividend Yield Ratio
Investors can be classified into types. The two predominant types are
growth oriented investors and value oriented investors. Growth oriented
investors invest in young growing companies. They expect returns in the
form of capital appreciation backed by the high rate growth in the
operations and profitability of the firm. On the other hand value
investors invest in mature stable companies and expect returns in the
form of stable cash flows paid in the form on dividends over and over
again. The Dividend Yield ratio is meant for the second type of
investors i.e. the value investors.
Formula
Dividend Yield = Annualized Dividend / Current Stock Price
Most companies pay dividends on a quarterly basis rather than on an
annual basis. Hence for the purpose of finding out the dividend yield,
analysts often annualize the dividend paid in the most recent quarter.
They think it better projects the dividend paying ability of a company.
Meaning
Value investors often look at the stock of a company, the way a real
estate investor looks at rental properties. They expect to put money one
down one time and expect to receive payments for the rest of their
lives. Hence the dividend yield tells them a percentage of their
original investment that they would receive each year, if they invested
in the stocks right away.
Assumptions
The dividend yield ratio assumes that the company in question will
continue making dividend payments at the same or higher rate than it is
currently doing. A historical analysis of the stock market will validate
this assumption. Historically companies that have been making dividend
payments continue to do so. This is because a dividend cut is adversely
received by the market as a very negative signal and the share price
immediately plummets. It is therefore reasonable to assume that the
company will continue to pay dividends until something untoward happens.
Interpretation
The dividend yield company must be compared to competing investment
options to get a better picture of the operations of the firm. It must
also be applied to the company’s own historical records to validate the
fact that it has indeed been making regular dividend payments.
- Stable Mature Companies: Dividend yield ratio is
meaningful only when it is applied to stable mature companies. Companies
in the field of utilities, hotels etc which have a regular and
dependable cash flow are the ones in which dividend payout ratio is an
important metric.
- Often Negligible: In advanced economy companies
like IT, Electronics and communication, the dividend payout ratio is
negligible. Investors look at these companies as engines of growth and
not as avenues of stable cash flow.
Put Call Ratio - Formula, Meaning, Variations and Interpretation
The put call ratio is the only financial ratio that does not
compare the current market price to any financial statement item. Rather
it compares what investors plan to do with a given stock or an index at
a later date. Put and call are derivative options. The put option
gives the seller a right but not an obligation to sell, however the call
option gives the buyer a right but not the obligation to buy. Analyzing
the put call ratio can give the investors some insight about where the
stock is headed for in the near future. This ratio is more relevant to
short term price movements rather than long term ones and is hence more
widely used by speculators who are looking to make a quick buck.
Formula
Put Call Ratio = Number of Put Options / Number of Call Options
This data is periodically published by the exchange. Hence investors can easily have a look at these numbers.
Meaning
A high put call ratio signals a bearish trend in the future and
indicates that short selling must be done to profit from this change. On
the other hand, a low put call ratio indicates a bullish trend which
speculators perceive as a signal to go long.
Variations
Many speculators believe that the put call ratio does not represent
the true picture. This is why there are a few variations of the put call
ratio that are used. Before making a call based on any put call ratio,
investors must understand what variation is being used and therefore how
to interpret it. Common variations are as follows:
Moving Average: Instead of using the put call data for a
single day, speculators usually use data for an extended period of time.
Usually the moving average used is that of 21 days. However, the number
of days can be different.
Money Weighted: Some speculators feel that money weighted put
call ratio is a better indicator since it informs about the possible
number of options that will be exercised.
Interpretation
Billionaire investors like George Soros are known to have used the
put call ratio to predict the market sentiment. It is said that
investors who have a constant eye on the put call ratio can gauge
changes in market sentiment faster than other investors and have a lead
time in modifying their positions and thereby benefitting from the
change.
Introduction to Liquidity Ratios
Liquidity can be defined as the ability of a firm to make good its
short term obligations. Most businesses function on credit. Hence to run
a business firms have to both extend credit as well as ensure that they
receive credit as well. Liquidity ratios measure the relationship
between the amounts of short term capital that the firm has locked in
its receivables versus the short term interest free debt it has acquired
in the form of accounts payables.
Liquidity ratios can be defined as the ratios which help analysts predict the short term solvency of the firm. Short term here is meant to be considered the period until the next business cycle which is usually 12 months.
Liquidity is the Life of a Business
A firm seldom has all the resources it needs to run the business. It
gets credit from its employees, suppliers, customers, the government and
such other entities. Each of these entities extends credit to the firm
on the assumption that it will make good its obligations when they are
due. Such obligations are usually due in the short term. Investors are
therefore very cautious about ascertaining whether the firm does in fact
have the capability to meet these obligations. Liquidity ratios help in
ascertaining this. With secondary data that is available in the annual
reports of the company, analysts often make projections about whether
the company has enough resources to survive the short run without
hampering its reputation or operations.
Liquidity has an Impact on Long Term Survival of the Firm
Amateur investors think liquidity is primarily short term. It does
not matter whether or not the company can pay its immediate bills, if
the long term prospects of the company look good, it is a good
investment. This is the farthest from the truth as history has shown
liquidity issues can have far reaching effects on the health of a firm
sometimes even endangering the very survival of the firm. Here is how it
happens:
- Banks Ask For Higher Interest Payments
- Suppliers Are Wary Of Extending Credit
- Attracting And Retaining Best Employees May Be As Issue
As a result of all these, present profitability is compromised and so
are the future growth plans of the company which now has to seek funds
at extremely high costs.
The best example of how liquidity problems can wreak havoc and
threaten the very survival of a firm is the recent Kingfisher Airlines
fiasco where the firm had to shut down operations because it could not
meet its short term obligations.
Current Ratio - Formula, Meaning, Assumptions and Interpretations
The current ratio is the most popularly used metric to gauge the
short term solvency of a company. This article provides the details
about this ratio.
Formula
Current Ratio = Current Assets / Current Liabilities
Meaning
Current ratio measures the current assets of the company in comparison to its current liabilities.
This means that the firm expects to collect cash from the people that
owe it money and pay to the ones that they owe money to on time. Hence
if the current ratio is 1.2:1, then for every 1 dollar that the firm
owes its creditors, it is owed 1.2 by its debtors.
The ideal current ratio is 2 meaning that for every 1 dollar in
current liabilities, the company must have 2 in current assets. However,
this varies widely based on the industry in which the company is
functioning.
Assumptions
The current ratio makes two very important assumptions. They are as follows:
- The current ratio assumes that the inventory that the company
has on hand will be liquidated at the price at which it is present on
the balance sheet. However, this may not be the case. Many times
inventories become obsolete and have to either be discarded on sold off
at a fraction of the cost that they were purchased for. The current
ratio does not warn the investors about these risks.
- The current ratio assumes that the debtors of the firm
will pay it on time. There is nothing wrong with this belief if it is
founded based on strong facts. The analyst must look at the past
performance of the firm in collecting its receivables and factor in the
late payments and bad debt charges to make the calculation more
meaningful.
Wrong Interpretations
- A moderately high current ratio is considered safe and
healthy. However, if the current ratio is too high, it means that
company is not effectively managing its current assets. Common symptoms
include a lot of obsolete inventory as well as trouble getting paid on
time by the debtors.
- A current ratio shows the company’s liabilities and
assets position for the next 12 months. It is possible that the
liabilities may be due in the next 6 months whereas the assets may be
due for realization only after 9 months. The current ratio does not
provide conclusive information about the liquidity position of the
company.
- Since receivables are included in the calculation, an
analyst must also be aware about the age of these receivables. Older
receivables are less likely to be collected and therefore investors must
be careful about making predictions based on these receivables.
Quick Ratio - Meaning, Formula and Assumptions
The quick ratio is a variation of the current ratio. However, a quick
ratio is considered by many to be a more conservative estimate than the
current ratio. This characteristic fetches it the nickname of being the
“Acid test ratio”.
The difference between the current ratio and the quick ratio is the
fact that quick ratio excludes the inventory. In theory this may seem
like a small difference, however in practice anyone who is aware about
the difficulties involved in liquidating inventories at the right price
will vouch for the conservativeness of this ratio. The quick ratio has
been discussed in greater detail in this article.
Formula
Quick Ratio = (Current Assets - Inventories) / Current Liabilities
Meaning
The quick ratio checks the company’s performance to fulfill its
obligations in a situation when it is not able to liquidate its
inventory. In such a situation the company will have to pay its current
liabilities out of the cash and cash equivalents that it has on hand and
the amount of money it has already tied up in accounts receivables. The
ideal quick ratio is considered to be 1:1. However, this varies widely
according to the different credit cycles prevalent if different
industries. Hence an analyst must look at competing firms and the
industry average before forming opinions based on the current ratio.
Assumptions
There are no assumptions made regarding the inventory, because it is
excluded from the calculation of this ratio. However, there are
assumptions made about debtors and the fact that they will pay up on
time to finance the payment of short term liabilities that a company has
on hand.
Wrong Interpretations
- The quick ratio of the company can become unreasonably higher
because of a large amount of accounts receivables that the company may
have on hand. The true measure of the liquidity management of a company
is its ability to complete the cash to cash cycle in the fastest
possible time. However if the company has a track record of being able
to recover its dues on time large receivable may be overlooked.
- Since the quick ratio is a variation of the current ratio it suffers from all the shortcomings faced by the current ratio.
Cash Ratio - Meaning, Formula and Assumptions
The cash ratio is limited in its usefulness to investors and
financial analysts. It is the least popular of the liquidity ratios and
is used only when the company under question is under absolute duress.
Only in desperate circumstances do situations arise where the company is
not able to meet its short term obligations by liquidating its
inventory and receivables and this is when the cash ratio comes handy.
Formula
Cash Ratio = (Cash + Cash Equivalents + Marketable Securities) / Current Liabilities
Meaning
The cash ratio indicates the amount of cash that the company has on
hand to meet its current liabilities. A cash ratio of 0.2 would mean
that for every rupee the company owes creditors in the next 12 months it
has 0.2 in cash. 0.2 is considered to be the ideal cash ratio.
Assumptions
The cash ratio is the most stringent of all liquidity ratios. Hence
there are no assumptions made. The cash and cash equivalent figures
stated on the balance sheet are facts and so are the current liabilities
stated on the balance sheet. Hence there is no assumption about future
events that need to occur as per the company’s plan.
The nearest the cash ratio gets to an assumption is that it believes
that marketable securities and cash equivalents can be quickly
liquidated. Under normal circumstances this is always the case. The only
case where liquidation of these securities would be an issue would be
the complete failure of the economic system.
Wrong Interpretations
- A high cash ratio may not be a good thing for a company. Cash
is an idle asset. It does not earn a sufficient rate of return.
Therefore companies must constantly work towards keeping the cash locked
up in gainfully employed investments. A large amount of cash on the
balance sheet may be an indicator that the company is running out of
investment opportunities.
- Wild fluctuations in the cash ratio may not be such a
bad thing either. It is not uncommon for companies to keep accumulating
cash and then using it at one go when a profitable opportunity arises.
It is this nature of the cash ratio that makes its usefulness limited.
The cash ratio usually creates more questions than it answers for the
financial analysts. Given the fact that analyst may not access to inside
information to answer these questions, the usefulness of these ratios
remain limited.
- Moreover, cash received is not necessarily cash earned.
The cash can be in the form of payments received in advance. Moreover,
third parties may have the right to demand the payment of that cash.
These rights do not appear on the balance sheet in the current
liabilities but are present in the footnotes and hence are not used in
the calculation of the ratio.
What is Negative Working Capital ?
Traditional financial analysts would consider a negative working
capital i.e. having more current liabilities than current assets, a sign
of imminent danger. This view was deep rooted in the belief that a
company must always have sufficient cash on hands to meet its short term
liabilities failing which the credit will dry up and the company will
get into a lot of trouble. However, of late negative working capital has
actually become a norm in many industries such as retail. There are
thriving businesses such as Wal-Mart that have based their entire
business strategies around negative working capital. This paradigm shift
in the opinion about negative working capital is what makes it an
interesting subject to read further about. This article will provide
more details.
What the Current Ratio Would Suggest
As per traditional analysis, investors would look at the current
ratio of a company with negative working capital with great concern. As
the current assets will be less than the current liabilities, this would
signal imminent danger to them. The current ratio of such a company
would be less than 1. However as we will see it is more than healthy.
What the Reality Is ?
In some businesses like in retail, inventory is taken from the
suppliers on sale or return basis. This has become the norm after big
ticket retailers such as Wal-Mart pretty much control the shelf space
which in turn controls what people buy. Suppliers of Wal-Mart therefore
find Wal-Mart in a commanding position and therefore are more than happy
to extend liberal trade terms. These terms state that Wal-Mart must
make the payment for the purchases in 45 days if they are able to sell
the inventory. In case they are not able to sell it, the suppliers will
be more than happy to take the goods back.
Wal-Mart while on one hand has negotiated a 45 day credit for itself,
sells to customers on cash. Assuming a period of 10-15 days to actually
sell the inventory, Wal-Mart still has one full month of interest free
cash for itself. They can use this cash for their treasury operations or
to fund future growth of their company. In case they fail to sell the
goods within 45 days, they just return the inventory or get an
extension.
Hence, a
negative working capital scenario has become beneficial
for many companies who meet their operating expenses out of interest
free credit extended by the suppliers.
Introduction to Turnover Ratios
Turnover ratios (also known as efficiency ratios) are a very
important class of ratios. These ratios are not only used by financial
personnel but also by the people in charge of operations. However,
we are going to consider these ratios from the point of view of outside
investors. This is because judgments have to be made about the
efficiency of the firm based on limited information at hand. Here is an
elementary introduction to what turnover ratios are and why they are
important.
Efficiency Means Business
Over the years, investors have realized one rule and that is
“Efficiency means growing business”. Any firm which is more efficient
than its peers in producing the same goods and services will be more
profitable in the short run. This profitability will allow the firm to
build a competitive moat around itself and these businesses often become
very valuable. This is like an investors dream formula for success. It
is for this reason that investors carefully look at the efficiency
numbers of newbie firms.
A Look at Efficiency through Financial Statements
Finding out whether the firm is efficient is difficult even for a
manager or an employee who has all the information at hand. Investors on
the other hand just have the financial statements. They have to use
these financial statements as their window into the operations of the
firm. This is possible because every activity done by the firm involves
costs and therefore leaves a trail on the financial statements. The
turnover ratios are the investors’ method to connect the dots. They use
information which is available in different financial statements. They
then aggregate this information together and make meaningful conclusions
about the operations of the company.
The Link between Sales, COGS and Turnover
Turnover ratios as the name suggest, are related to sales. The
logic is that given a certain amount of assets, how much sales can a
company achieve? Therefore turnover ratios are always a comparison
between an income statement item i.e. sales and the corresponding
balance sheet item. For example if we compare fixed assets to sales, we
get fixed asset turnover ratio. On the other hand when we compare
accounts receivable to sales we get accounts receivable turnover ratio.
In case of inventory turnover ratio we use the COGS figure listed on
the income statement rather than the sales figure. This is because
inventory is reported at the cost price.
In conclusion, turnover ratios provide early clues to the efficiency
of a firm. This can go a long way in making a successful investment and
therefore an investor must learn how to use these ratios to his/her
advantage.
Accounts Receivable Turnover Ratio
Accounts receivable are a very important part of the current assets
of any business. Like inventory, accounts receivable are considered a
necessary evil to do business. Large companies hardly conduct any
transactions on cash basis with their wholesalers and distributors. The
transactions are largely conducted on credit and therefore lead to the
existence of accounts receivable on the balance sheet.
Accounts receivable are a dangerous item. If the firm is taking too
long to collect the accounts receivable, it means that the firm is not
utilizing its capital in the best possible way. Buyers are using the
firms interest free credit and making delayed payments to the firm which
has to arrange for working capital at a cost. Also the older accounts
receivable become, the less likely they are to be collected. Hence,
accounts receivable turnover ratio is a closely watched number.
Formula for Accounts Receivable Turnover Ratio
Accounts Receivable Turnover Ratio = Net Credit Sales / Average Accounts Receivable*
Average Accounts Receivables = (Beginning Accounts Receivables + Ending Accounts Receivables) / 2
This formula converted to a percentage shows the average amount of
receivables that the firm has at any given point of time. Let’s say the
answer was 27%, it would mean that on an average the firm has 27% of its
receivables outstanding at any given point of time.
Number of Days Outstanding Ratio
The number of days of receivables outstanding is considered by many
to be a different ratio when in reality it is just an extension of the
same ratio. In the above case we have reached an answer expressed in
terms of percentage. All we need to do is to convert the answer to the
number of days. Lets use the above example to understand how the number
of days is calculated.
Number of Days Receivables Outstanding = (27 / 100) * 360
*For the purpose of calculation of ratios accountants assume that the year has 360 days.
The answer to the above is 97.2 days. The firm therefore turns over
its receivables every 97.2 days. This means that the old receivables are
replaced by a new set of receivables every 97.2 days. Therefore in 360
days, the receivables are turned over (360/97.2) 3.7 times.
Interpretation
The accounts receivables ratio is a good indicator of the bargaining
power that a firm has amongst its buyers. If the firm has good
bargaining power, there will be less receivable outstanding and the
turnover will be higher.
Accounts Payable Turnover Ratio
Just like accounts receivable turnover ratio show the financing that
the firm is providing to its buyers interest free, the accounts payable
turnover ratio show the financing that the firm is able to receive from
its vendors and suppliers free of cost. Since there are no interest
charges involved and this is purely trade credit, the objective of the
firm ideally should be to pay its bills as late as possible. By doing
so, they are using the vendors money to temporarily finance their own
business without any cost attached. However, due care must be taken that
vendors are not passing off the finance charges in the form of higher
prices for products purchased. In that case, the firm may be better off
using its own money to buy products at a lower price from vendors that
charge a lower price.
The Formula
Accounts Payable Turnover Ratio = Net Credit Purchase / Average Accounts Payables*
Average Accounts Payables = (Beginning Accounts Payables + Ending Accounts Payables) / 2
This formula converted to a percentage shows the average amount of
payables that are outstanding. The calculation of this ratio is just
like the calculation of accounts receivable turnover ratio. Hence we can
use the same example to understand the calculation of this ratio as
well. However in this case we shall consider the accounts payables to be
40% of all credit purchases
Number of Days Outstanding Ratio
The calculation of number of days outstanding ratio therefore is as follows:
Number of Days Receivables Outstanding = (40 / 100) * 360
*For the purpose of calculation of ratios accountants assume that the year has 360 days.
The answer to the above is 144 days. The firm therefore pays its
bills every 144 days on an average. This means that the old bills are
replaced a new set of bills every 144 days. Therefore in 360 days, the
receivables are turned over (360 / 144) 2.5 times.
Interpretation
The accounts payable turnover ratio can be considered to be the exact
inverse of the accounts receivable turnover ratio. In that case the
objective was to receive payments as soon as possible. Here the
objective is to delay payments as much as possible and utilize this free
source of funds to finance the firm’s own business short term.
Bargaining power once again has a big role to play in the accounts
payable ratio. A lower accounts payable ratio entails that the firm has
the bargaining power which allows it to pay its vendor late. However,
COGS of the company must also be checked to ensure that more payment
period is not being passed off as high price to the firm.
How to Use Accounts Payable Turnover Ratio to Bargain with Buyers
It is a myth that financial ratios are to be used only by investors
and analysts in deriving a fair valuation for the firm. In reality,
financial ratios are used by a wide variety of people for a wide variety
of reasons. A common usage is by the sales department. Usually sales
departments in large companies are converted to cash. Managers,
therefore have to determine the optimum quantum of credit that must be
given to the buyers to receive the fastest possible payment. The
following article will explain a common practice amongst sales managers
to achieve a faster repayment from the buyers.
How Credit is Determined
The sales managers have a fair degree of discretion in determining
the credit to be given to the buyers. They however have to work within
limits set by the organization. The parameter of these limits is usually
determined by the following:
- Internal Credit Policy: Every firm has an internal
policy which determines the amount of credit that can be given to the
buyers. These policies however only suggest the maximum number of days
and such other parameters.
- Creditworthiness of the Buyer: The sales manager
is also expected to look at the creditworthiness of the buyer. This can
be done by looking at a credit report, if the buyer is rated by a credit
rating agency or by finding out general information from other
non-competing suppliers.
Based on a number of factors, the sales manager can give credit to
the buyer. However, smart sales managers use ratios to their advantage
and this is how.
How Accounts Payable Turnover Ratio Can Help
- What the Buyer is Used to: The idea is to calculate
the number of days in which the buyer usually makes a payment to its
suppliers. This can be done easily of the firm is publically listed or
publishes its financials. The sales department can calculate the
accounts payable turnover ratio from the buyers financial statements.
This is the time that the buyer takes on an average to make payments to
its suppliers. The sales manager can now design payment terms to induce
the buyer to pay up at the earliest.
- Extend Credit Accordingly: Sales managers usually
see if they are in a commanding position while making the sale. They
then provide early payment discounts which are slightly lower that the
average time the buyer takes to pay. This ensures that the discount is
within the reach of the buyer who usually complies making the fastest
payment possible.
Fixed Asset Turnover Ratio
Fixed assets i.e. property, plant and equipment represent the single
largest investment any company makes in its operations. It is therefore
important that a company keeps a close eye on whether these investments
are performing well and generating adequate revenue and profit to
justify the expenditure. While it is impossible to come up with a single
number that explains the efficiency of the company in utilizing its
fixed assets, the fixed asset turnover ratio comes close. Here are the
details of this ratio.
The Formula
Fixed Asset Turnover Ratio = Sales Revenue / Total Fixed Assets (Average of the two balance sheets)
How to Apply It?
The fixed asset turnover ratio is best applied when there is adequate
context. Dividing the two numbers and getting a third number makes
little sense unless you can compare it with something.
The best comparison in with the company’s past records itself. If the
company has made a new addition to the fixed assets, one can find out
the new fixed asset turnover ratio and compare it with the old fixed
asset turnover ratio and see if there have been any substantial
improvements as a result of the addition. Efforts must be made to ensure
that extraneous variables like general condition of the economy et al
are nullified to get a true picture of the state of affairs.
Another popular comparison is to benchmark the fixed asset turnover
ratio of a company with those of other companies in the same industry.
Same industry is important because different industries have different
fixed capital requirements. Service oriented companies usually have less
fixed capital requirement as compared to heavy manufacturing. Some
companies use an average of the other companies in the industry to
benchmark their performance against whereas others look at the best in
the field and try to compete with them.
Interpretation
The fixed asset turnover ratio provides the best estimate of the
operating leverage of the firm. If increases in fixed assets lead to
disproportionate increases in sales, then the firm has a high operating
leverage. In some ways therefore, a wildly fluctuating fixed asset
turnover ratio is a measure of high risk that a company is facing.
Also investors should be wary of changes in the revenue policy.
Changes in the revenue policy can affect sales which can make this ratio
artificially higher or lower thereby distorting the investors
perception of the efficiency of the company.
Inventory Turnover Ratio
A company is said to be more efficient when it keeps the least
inventory on hand to make the sales it does. The systems of the company
must be so efficient that goods are available for sale as and when
required and spend the least amount of time waiting in a warehouse. This
is because inventory has many costs associated with it. Until earlier
it was known as the necessary evil. Not only is capital locked in
inventory creating an opportunity cost, there are other costs involved
like warehousing, security, insurance, pilferage and so on.
The idea that inventory should be minimized if not eliminated caught
the fancy of management gurus from 1980’s onwards. Japanese companies
showed how they could produce efficiently at lower costs by implementing
Just in Time inventory systems. Many years later, Michael Dell
revolutionized the computer industry with his made-to-order business
model that enabled him to function with zero inventories and earning
almost double the profits that entrenched competitors with deep pockets
could manage.
Since inventory is such a make or break item in the financials of a
company, there is obviously an interest amongst analysts and investors
who want to have a close watch on its performance. Hence, the inventory
turnover ratio is amongst their favorites. This article explains the
inventory turnover ratio in detail.
The Formula
Inventory Turnover Ratio = Cost Of Goods Sold / Average Inventory*
- Average Inventory = (Beginning Inventory + Ending Inventory) / 2
- Note that instead of Sales, Cost of Goods Sold is used
to calculate this specific turnover ratio. This is because inventories
are stored at cost price.
How to Apply it ?
Like all ratios, inventory turnover ratio also needs the same context
for the numbers to become meaningful. It needs to be compared with the
performance of others. Usually the comparison is done between:
- The company’s own inventory turnover ratio for previous years.
- The inventory turnover ratio of other companies in the
same or different industry. Different industries are usually considered
in the calculation of inventory turnover ratio. This is because the best
practices can usually be applied regardless of the industry. Dell’s
made to order business model has been replicated countless times in
different industries.
Interpretation
Caution must be exercised by the analysts in drawing conclusions
based on the inventory turnover ratio. Sometimes companies buy large
amounts of inventories to beat the forthcoming price hikes. This may
show up as an increasing inventory turnover ratio but may not be a bad
signal in reality.
Also analysts must be wary of change in inventory policies before calculating and interpreting this ratio.
Working Capital to Sales Ratio - Meaning, Formula, Assumptions and Interpretation
Formula
Working Capital to Sales Ratio = Working Capital / Sales
Meaning
Stating the working capital as an absolute figure makes little sense.
Consider two companies, both having the same working capital of USD
100. While one company uses this working capital to generate sales of
USD 500, the other uses the same amount as working capital to generate
USD 1000 in sales. Which one do you think will be more profitable? Which
one do you think is more efficient?
When companies use the same working capital to generate more
sales, it means that they are using the same funds over and over again.
This is why this ratio is also called “Working Capital Turnover Ratio”
as it measures the number of times working capital has been turned over. The higher the sales, the more the profits and therefore the more appropriate use of working capital has been made.
Assumptions
The working capital to sales ratio uses the working capital and sales
figures from the previous year’s financial statements. Hence, there is
obviously an assumption that working capital and sales have been
accurately stated. Companies may over stock or under stock because of
expectations of shortage of raw materials. These influences are however
short term. Thus while reading this number the analyst must compare it
with the past numbers to see if this is usual state of affairs for the
company or whether this is an exception.
Interpretation
- Efficiency Vs Riskiness: While many investors feel
that a company must use as little working capital as possible, there are
many that have other opinions too. These are conservative investors
that fear having too little working capital can be dangerous as it is
capable of causing a cash crunch and bringing the operations to a halt.
These investors believe that in a cash crunch situation, the company may
have to borrow at unfavorable terms nullifying the advantage gained by
maintaining lower working capital and causing loss in the form of lost
reputation.
These investors may be true because the stock market takes any news
of cash shortage very seriously and the stock plummets in the market.
But the price in the stock may be short term.
- Room For Improvement: Working capital to sales
ratio may be a hint to the company that it needs to rethink its
policies. If the competitors can get a better deal from suppliers and
buyers then the company needs to build more bargaining power in the
market. This is a signal that improvements need to be done.
Introduction to Profitability Ratios
The ultimate aim of all business is to generate profit. That is what
the investors invest for, management plans for and employees execute
for.
Profitability Needs Context
Two companies may be generating the exact same amount of rupee
profits, however that does not mean that they are equally profitable.
This is because profit is an output measure. And jumping to a conclusion
only by looking at the output and not the input that was used to
generate the output would not be very prudent! The profit numbers are
therefore seen in relation to various measures of inputs like capital,
equity, assets etc. Each of these measures tell a separate story about
how the company is performing specific to the input. Analysts often use
these numbers together, connect the dots and find out the true picture
of the company’s profitability.
Different User Groups Have Different Needs
Shareholders want the business to generate as much profit as
possible. Debt holders on the other hand are content with enough money
to ensure that they get paid. Banks want to know whether the company has
been making efficient use of fixed assets before granting a loan to buy
another one. Thus different user groups have different needs. Hence
there is a need for a wide variety of profitability ratios that serves
them.
Drivers of Profitability
A careful analysis of the profitability ratios also unearths the
drivers of profitability. Analysts can look at the financial ratios of
an extended period of time and use correlation analysis to unearth the
same. The ability to express the company’s business as an accurate
input output model is vital for analysts. This is because they can then
guess the input, obtain the output and value the firm based on this
information. Common drivers of profitability include economies of scale,
economies of scope, mechanization, automation, investment in brand
value etc.
Cycles and Trends
Industries have their specific business cycles. These business cycles
have similar duration and the highs and lows that the business will
experience can also be gauged fairly accurately. Profitability ratios
help in doing the same. Analysts use many years ratios and then conduct a
trend analysis to find out the patterns hidden in the data. This helps
them find out how the sales are expected to move in the next quarter.
What are Common Size Statements ?
Common size statements are not financial ratios. Rather they are a
way of presenting financial statements that makes them more suitable for
analysis. However, analysts always use them in conjunction with ratio
analysis. In fact, financial analysts use common size statements as the
starting point to help them dig deeper. Common size statements tell them
what particular group of ratios deserves more attention for any given
set of financial statements.
What Are Common Size Statements ?
Common size statements are financial statements expressed in
percentage form. Therefore a common size income statement would consider
the sales figure as 100%. Every expense in the income statement
will then be expressed as a percentage of the sales figure. Similarly in
common size balance sheet the total assets figure is considered to be
100%. Everything else is expressed as a percentage of the same.
Standardized for Comparison
The logic behind creating common size financial statements is that they are easily comparable.
Analysts can compare the COGS across two companies and state which one
has lower COGS without any calculation! Thus, using the common size
statements the analysts look step by step at the financial statements
and compare them with other companies. This helps them understand how
the company has a different asset structure and cost structure in
comparison to its competitors and whether it is favorable or unfavorable
for the organization.
Trend Analysis
Trend analysis is analysis which entails comparison with the
company’s own past performance. The problem in conducting this analysis
is that all the numbers keep changing and there is no fixed base. With
the help of common size statements, the base gets fixed at 100% and all
the numbers can be compared across years. Thus with the help of this
trend analysis, a company can figure out whether its advertising costs
have gone up compared to last year and if so why?
What are Profit Margins ?
The untrained investor uses profit and profit margin interchangeably.
This is not technically correct. The difference may be minor but it is
vital. This article will explain about profit margins in detail.
Profit vs. Profit Margins
Profit and profitability are two different things. Although they may be closely related, they have a subtle difference.
Profit is the absolute number that a company is earning. Profitability on the other hand implies profit margins.
Margins are calculated on a per unit basis. Secondly they consider the
amount of capital that has been employed to generate the profit. Thus
profitability i.e. profit margins are a wider concept.
There are different measures of profitability that a company can
choose from. Similarly there are different profit margins that a company
can choose from. It is common practice to convert each profit figure
into a margin.
Based On Competitors
Margins need to be compared with industry and relevant competition. A
15% return may be great for a utility company but may suggest serious
problems with an information technology firm. Luxury brands such as
Armani, Rolls Royce, and Rolex have very high profit margins. This is
because the cost that they put in is small and they are reaping the
benefits of the brand that they have created. Comparing a Rolls Royce
profit margin to a Maruti would not be advisable even though both of
them are cars.
Diminishing Returns Analysis
Profit margins are very important to understand how diminishing
returns work in the context of the firm. Using various profit margins,
the firm can look at the profitability figures and find out the level of
production where the costs are minimum and profit margins are high.
This is the quantity that the company should optimally produce.
Cost-Volume Profit Analysis
The drawback with profit margins is that they do not consider volume.
It is for this reason that a separate Cost-Volume-Profit analysis often
needs to be done. Usually profit margins and volume are inversely
proportional to each other. Higher margins indicate lower volumes and
vice versa. There are unusual cases where margins and volumes are both
high. However, these are usually examples of monopoly.
Return on Assets (ROA) - Meaning, Formula, Assumptions and Interpretation
Another metric that is widely used by investors to gauge the
profitability of a company is Return on Assets (ROA). More about this
very important ratio has been stated in this article.
Formula
Return on Assets = Earnings / Asset Base
- Some calculations may include intangible assets while some others may exclude them from calculation of Return on Assets.
Meaning
The Return on Assets (ROA) ratio shows the relationship between
earnings and asset base of the company. The higher the ratio, the better
it is. This is because a higher ratio would indicate that the company
can produce relatively higher earnings in comparison to its asset base
i.e. more capital efficiency.
Assumptions
- No Write-downs:
The ROA ratio assumes that the assets have been valued fairly on the
books. However, in real life, it is a known fact that companies keep
over and/or under valuing their assets to reduce taxation. This may
affect the ROA adversely and reduce its usability as a profitability
metric.
- Excess Cash and Assets for Sale:
The Return on Assets ratio assumes that the company is using all its
assets to run the day to day operations. This assumption is likely to be
proved incorrect. A lot of companies hold significant cash on their
balance sheet. The most valuable company in the world Apple Inc is one
such example. Also many other companies hold a lot of impaired and
obsolete assets which they plan to sell in the near future. This brings
down the Return On Assets (ROA) ratio.
Interpretation
- Does Not Depend on Leverage:
Return on assets compares the earnings that a company has generated
to its asset base. The asset base could be financed by equity or by debt
but it will not make a difference. Return on Assets is therefore
independent of leverage.
- Stage of Growth:
Return on Assets is very sensitive to the stage of growth that a
company is currently experiencing. In the introduction and growth stage,
companies invest a lot of money to create asset bases. They may not use
the asset base immediately and the benefits may be realized years
later. Hence, two companies in the same industry, but at different
stages of growth, will have very different Return On Assets.
Return on Equity (ROE) - Meaning, Formula, Assumptions and Interpretation
Return on Equity (ROE) is probably the most important number in the financial universe.
Every
company is driven by profit and Return on Equity (ROE) is considered to
be the best indicator of the profitability of a company. Debt
holders just want to get their interest and principle back i.e. they
will obtain a fixed rate of return. On the other hand equity holders get
a variable return. For this reason, this number is considered more
important than Return on Assets or Return On Invested Capital.
Formula
Return On Capital Invested = Profit After Tax (PAT) / Equity
Return on Equity (ROE) is one of the few ratios that uses after tax profits
Meaning
Return on equity tells the shareholders how many dollars of post-tax
earnings, the company generated for every dollar of equity capital it
had.
Assumptions
- No Dilution: The Return on Equity (ROE) figure does
not take into account the outstanding share warrants. This is because
there is uncertainty as to whether the derivate products will be
exercised and whether the equity base of the company will change.
However, if warrants are exercised and equity is diluted, the ROE figure
could change drastically.
- Leverage to Continue: The return which is being
compared against equity has been generated by using debt too. The Return
on Equity (ROE) ratio assumes that the current gearing ratio i.e.
leverage of the firm is likely to continue in the future. Moreover
Return on Equity (ROE) may go up or down because of a change in leverage
alone. ROE going down could be a good sign too because it would mean
de-risking of the company.
- Taxation to Continue: The Return on Equity (ROE)
also assumes that the taxation structure will remain the same in the
future. If comparisons are being made with past ROE’s then there is an
implicit assumption that the tax structure has not changed.
Interpretation
- Valuation Multiple: ROE is the most widely used ratio
for valuation of a firm. Equity investors are interested in the earnings
that the firm will generate for them. ROE provides a direct measure.
Therefore investors usually buy shares at multiples of ROE.
- Gestation Period: ROE may be affected by the
gestation period. A company may borrow money today to invest in long
term facilities. The returns may take some time to start. This will show
a low ROE but may be a positive sign. For this reason, ROE may not be
an accurate measure.
Return on Invested Capital (ROIC)
Return on Invested Capital (ROIC) is another popular metric that is
used widely in financial analysis. The reason for its popularity is that
like ROA, ROIC can be used by both equity and debt holders. Also, like
ROA, it provides data about return to the company as a whole and is not
affected by leverage. Here is more about Return on Invested Capital;
Formula
The formula for calculating ROIC is as follows:
Return on Invested Capital = EBIT / Invested Capital
- Deriving Invested Capital: Note that Invested Capital
is not the same as Capital listed on the balance sheet. Neither is it
the balance sheet total. Invested Capital is a term analysts have coined
in the recent past to denote capital that has been listed for the long
term in the company’s operations. Invested capital is derived by
starting from the Balance Sheet Liabilities total and then subtracting
the current liabilities from it. This is because current liabilities are
not sustainable sources of long term financing and therefore cannot
qualify as capital.
Meaning
The Return on Invested Capital (ROIC) metric measures the company’s
efficiency at allocating its resources to generate the maximum return.
Thus ROIC shows the relationship between invested capital and return. It
must be thought about as having Rs X in earnings for every rupee in
invested capital.
Assumptions
- Tax Planning not Considered: The Return on Invested
Capital (ROIC) used EBIT which is a pre-tax figure. This ratio does not
consider that companies can make significant differences to their
profitability with the help of tax planning strategies. Some analysts
use both pre-tax and post-tax ROIC numbers to get a better picture of
the company’s operations.
- Accurate Book Values: The Return on Invested
Capital (ROIC) assumes that the book values stated are accurate. In many
cases, the book values and the market values of assets are very
different. One such example is land. Thus, ROIC becomes a misleading
figure. This is because many times analysts consider the opportunity
cost based on market value and the ROIC drops drastically.
Interpretation
No Break-Up Provided: ROIC does not provide break up about whether income has been earned from regular operations or from one time activities.
Used to Evaluate Acquisitions: Return on Invested Capital
(ROIC) is useful in case of companies that have done many acquisitions.
Since it is difficult to segregate the cash flows of the two merged
companies, ROIC with and without the acquisition serves as a measure of
gauging success.


