Difference Between BCG and GE Matrices
BCG matrix is a matrix used by large corporations to
decide the ratio in which resources are allocated among various
business segments. Similar to this, GE matrix also
helps firms decide their strategy with respect to different product
lines, i.e. the product they should add in the range of products offered
by them and in which opportunity the firm should invest.
Both BCG matrix and GE matrix are two-dimensional models, that are
used by big business houses, having several product lines and business
units. The latter was developed as an improvement over the former, and
so overcomes many limitations. This article excerpt will help you
understand the differences between BCG and GE matrices, take a read.Content: BCG Matrix Vs GE Matrix
Comparison Chart
| Basis for Comparison | BCG Matrix | GE Matrix |
|---|---|---|
| Meaning | BCG Martrix, is a growth share model, representing growth of business and the market share enjoyed by the firm. | GE Matrix implies multifactor portfolio matrix, that assist firm in making strategic choices for product lines based on their position in the grid. |
| Number of cells | Four | Nine |
| Factors | Market share and Market growth | Industry attractiveness and Business strengths |
| Objective | To help companies deploy their resources among various business units. | To prioritize investment among various business units. |
| Measures used | Single measure is used. | Multiple measures are used. |
| Classification | Classified into two degrees | Classified into three degrees |
Definition of BCG Matrix
BCG Matrix or otherwise known as Boston Consulting Group growth share matrix is used to represent the company’s investment portfolio.Large corporations usually face problems in allocating resources amongst various units and product lines. To cope with this problem, in 1970, Bruce Henderson designed a matrix for the Group called as BCG matrix. It is based on two factors which are:
- The growth rate of the product-market.
- Market share held by the company in the respective market, in comparison to its competitors.
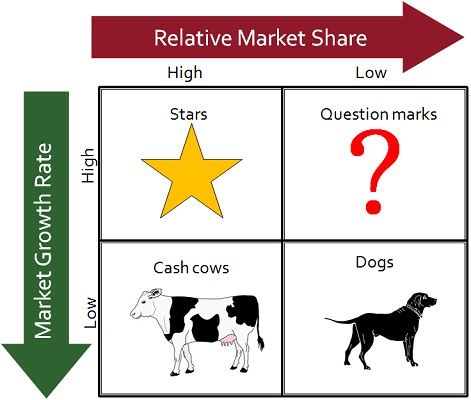
BCG – Growth Share matrix
- The vertical axis shows market growth rate, which is a measure of how attractive the market is?
- The horizontal axis indicates relative market shares, which is an indicator of how strong the company’s position is?
- Stars: It represents those products which are growing at a faster rate and requires the huge investment to maintain their position in the market.
- Cash Cows: The products whose growth is low but holds high market share. They reap a lot of cash for the company and do not require finance for expansion.
- Question Marks: It indicates those products which possess a low market share in a high-growth market and so need heavy investment to hold their share in the market, but do not generate cash in the same proportion.
- Dogs: Dogs represents those products, which neither have a high growth rate nor high market share. Such products generate enough cash to maintain themselves but will not survive in the long term.
Definition of GE Matrix
GE matrix, alternately known as General Electric Model is a business planning matrix. The model is inspired by traffic lights which are used to manage traffic at crossings, wherein green light says go, yellow says caution and Red say stop.The matrix comprises of nine cells, with two major dimensions, i.e. business strength and industry attractiveness. Business strength is influenced by market share, brand image, profit margins, customer loyalty, technological capability and so on. On the other hand, industry attractiveness is influenced by drivers such as pricing trends, economies of scale, market size, market growth rate, segmentation, distribution structure, etc.
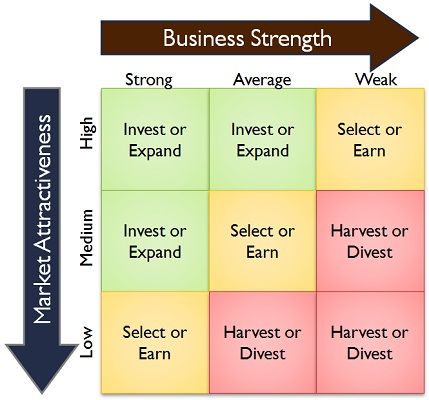
GE – Portfolio matrix
Key Differences Between BCG and GE Matrices
The points depicted below, elaborate the fundamental differences between BCG and GE matrices:- BCG matrix can be understood as the growth-share model, that reflects a growth of business and the market share possessed by the firm. On the other hand, GE matrix is also termed as multifactor portfolio matrix, which businesses use in making strategic choices for product lines or business units based on their position in the grid.
- BCG matrix is simpler in comparison to GE matrix, as the former is easy to draw and consist of only four cells, while the latter consist of nine cells.
- The two dimensions on which BCG matrix is based are market growth and market share. Conversely, industry attractiveness and business strengths are two factors of GE matrix.
- BCG matrix is used by the companies to deploy their resources among various business units. On the contrary, firms use GE matrix to prioritize investment among various business units.
- In BCG matrix only a single measure is used, whereas in GE matrix multiple measures are used.
- BCG matrix represents two degrees of market growth and market share, i.e. high and low. In contrast, in GE matrix there are three degrees of business strength, i.e. strong, average and weak, and industry attractiveness, are high, medium and low.

BCG matrix is to evaluate the strategic position of the business brand portfolio and its potential. It classifies business portfolio into four categories. For understanding this, BCG Matrix Examples / Resources are essential.
ReplyDeleteYou have a good point here!I totally agree with what you have said!!Thanks for sharing your views...hope more people will read this article!!! Harrison Barnes Recruiter
ReplyDeleteyou help me a lot to understand these marketing tools
ReplyDeleteI find it helpful to understand how businesses can prioritize their investments using these matrices.
ReplyDelete